


 Key factors are 【animation display】 and
【rigorous project evaluation】
Key factors are 【animation display】 and
【rigorous project evaluation】
To prevent global warming, a substantial reduction in CO2 emissions has become an urgent issue. Accordingly, the effective use of wind power energy (natural energy) is attracting attention as a clean and environmentally friendly solution.These wind power generation facilities range from those with a few wind turbines to large wind farms with dozens of wind turbines.
The generated energy output from a wind turbine is proportional to the wind speed cubed. Therefore, accurate selection of sites with favorable wind conditions, even to the pin-point level, is very important. Like many parts of the globe, the topography of Japan is mostly characterized by mountainous areas and complex terrain with few flat areas. This circumstance dictates the constructions of wind power generation facilities in topographically complex areas such as mountainous regions.
Therefore, topographical effects such as flow impingement, flow separation, flow reattachment, and reverse flow (following figure) need to be taken into consideration for selecting sites for wind turbine construction. Future projects on wind power generation facilities will require rigorous and highly accurate evaluations of the site-specific wind conditions.
With this background, we have developed RIAM-COMPACT® (Research Institute for Applied Mechanics, Kyushu University, COMputational Prediction of Airflow over Complex Terrain), an innovative non-stationary, non-linear wind synopsis simulator, with 【animation display】 and 【rigorous project evaluations】 as key factors.
Wind characteristics and wind disturbances over complex terrain (terrain-induced turbulence) are two of the major issues to be considered for the installation of wind power generation facilities. Accordingly, the simulator is equipped with an easy-to-operate capability to visualize wind characteristics in the form of animation. The simulator also facilitates the intuitive comprehension and evaluation of terrain-induced turbulence prior to the installation of wind power generation facilities.
Additional features of the simulator include 1) the estimation of the annual energy generation (kWh) and the utilized capacity (%) and 2) a display of the wind rose and vertical profile of wind speed at the construction sites of wind turbines.
 Visualization Gallery
Main features of RIAM-COMPACT® software
- Non-stationary, non-linear fluid engineering CFD (Computational Fluid Dynamics) model
- Based on an LES (Large-Eddy Simulation) turbulence model that is considered more promising than a RANS (Reynolds-Averaged Navier-Stokes) turbulence model, 【wind paths】 and 【wind disturbances】 over complex terrain can be simulated and animated.
- Applicable for all kinds of flat and complex terrain throughout the world with a powerful reciprocal linkage between GIS (Geographical Information System) and CFD.
(Utility Model: “Fluid analysis support system,” registration number: 3128436)
Comparisons of various models for predicting wind conditions
What do 【non-linear】 and 【non-stationary】 mean ?
 Result of the non-stationary, non-linear model, RIAM-COMPACT®
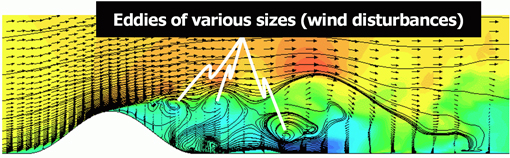 Non-stationary, non-linear models such as RIAM-COMPACT® simulate the wind flow that matches the wind flow that we experience every day. The wind disturbances can be understood intuitively. Non-linear models are applicable for both flat terrain and steep complex terrain.
Visualization Gallery
Result of a stationary, non-linear model, RANS
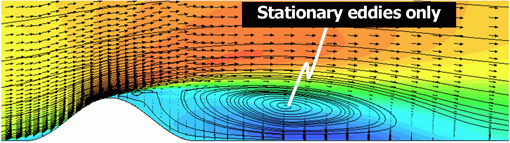 Stationary, non-linear models simulate the same results but are averaged in time.
Result of a linear model
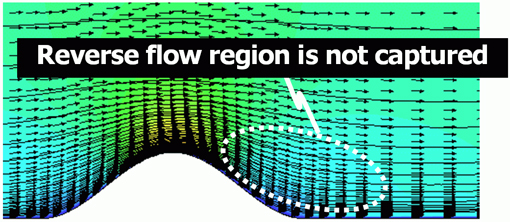 Linear models are designed for flat terrain. When applied to steep topography,
flow separations (reverse flow regions) cannot be predicted.


Example: Askervein Hill, UK
- The 50m MEM Elevation Data of the Geographical Survey Institute of Japan and the 10m HGF elevation data of Hokkaido-chizu. Co., Ltd. can be used.
(Please note: These elevation data need to be purchased separately.) - RC-Elevgen accepts high-resolution elevation data (GIS elevation data, latitude and longitude ASCII elevation data).
(Please note: These elevation data need to be purchased separately from RIAM-COMPACT, Co., Ltd.) - These data were created for points of interest from paper maps, CAD (Computer Aided Design) data in DXF (Data eXchange Format), and satellite data.
- The grid widths in the horizontal and vertical directions can be modified
(variable grids). - RC-Elevgen is capable of outputting the longitude and latitude data of the computational grid points.
- Locations of observation poles and wind turbines can be displayed as symbols by specifying the decimal longitudes and latitudes of their locations.
- Computational grids for 16 wind directions can be saved all at once.
Features of computational grids
- Horizontal direction: Orthogonal
- Vertical direction: High concentration close to the surface and terrain following

Example: Askervein Hill, UK
A result viewed with the computational result visualization software RC-Scope
- Up to 1000 wind turbines can be created and viewed in 3D as in the figure
- Specification of wind turbine locations in decimal latitudes and longitudes
- Wind directions can be set by the user
- Rotor diameters can be set by the user
- Tower or pole heights can be set by the user
- Display colors can be set by the user

 Example: Askervein Hill, UK
Colors indicate land use.
Black points indicate computational grids.
- Based on geodetic coordinate data created by the user, land use data (surface roughness information) for the computational grid points can be obtained on-line.
- When the land use data (surface roughness information) are entered into the wind field solver, the influence of the surface roughness can be included in the simulation.
(Please note: This service requires a user-specific ID and password that will be issued after signing an annual maintenance contract.)

- RC-Solver is compatible with multi-CPU and multi-GPU
- A computation can be started by specifying only a few computational parameters, input files and an output folder.
- Time-series data of the three components of the wind velocity can be output from as many as 50 selected grid points.
Visualization Gallery
Comparison of the calculation speed of multi-CPU (upper) and the single GPU (lower)

 Example: Askervein Hill, UK
The following techniques to visualize various flow properties are available on the standard edition of RC-Scope.
- Computational grids
- Velocity vectors
(left figure) - Isolines, isosurfaces
- Color shading
- Streamlines
- Pathlines
- Streaklines
- Trajectories of tracked particles
(right figure) - Timeline
- Surface path rendering
- Volume rendering
Visualization Gallery

- Annual energy generation (kWh), utilized capacity (%), and wind roses can be calculated from the 16 wind-direction dependent simulation results entered into the system. In this procedure, the correlation of the simulated results and observed data is taken into consideration.
- Consideration of wake loss is also possible.
- The calculated variables and diagram listed above can be viewed on a map
(upper figure). - RC-Explorer has the capability to report data in XML (eXtensible Markup Language) format.
- Wind roses and vertical wind velocity profiles can be output for any wind turbine location.
- Wind maps can be output for any height.
- RC-Explorer can output composite wind maps for 16 wind directions (local wind maps) that account for the occurrence frequency of wind conditions observed in the field.
- RC-Explorer can output the blow down and blow up angles within the swept area of the wind turbine.
- Wind synopsis data can be output in Google Earth format. ( lower figure)
- The design wind speed for the location of a wind turbine can be evaluated using methods compliant with “Guidelines and descriptions for the structural design of wind power generation facilities and supporting objects: 2007” (Japan Society of Civil Engineers) and “Guidelines and descriptions for architectural loads (2004)” (Architectural Institute of Japan).
Fields of application for RIAM-COMPACT® Natural Terrain Version
- Wind engineering applications
- Investigation on the generation mechanism of topographically induced severe local wind in mountainous regions
- Countermeasures against wind disasters in the vicinity of transmission line towers in mountainous regions
- Countermeasures against typhoon-induced wind disasters on historical buildings
- Countermeasures against tornado-induced wind disasters
- Railroad applications
- Development of a support system for safe railroad operation in gusty and severe wind conditions
- Countermeasures against wind disasters in the vicinity of railroads and creation of wind condition maps
- Aviation and shipping applications
- Wind synopsis assessment for airport construction on isolated islands
- Prediction of wind conditions for a docking support system for supertankers
- Forestry applications
- Creation of hazard maps (specifying severe wind areas) as a part of countermeasures against typhoon-induced wind disasters
- Prediction of forest fire spread
- Prediction of advection and dispersion of forest fire smoke, volcanic gases, atmospheric pollutants, and pollen
- Leisure applications
- Information delivery service aimed at yacht racing, fishing, golf, and ballooning
 Countermeasures against tornado-induced wind disasters |
 Investigation on the generation mechanism of topographically induced severe local wind in mountainous regions |
 Prediction of advection and dispersion of volcanic gases (Example: Miyake Island) |
 Countermeasures against wind disasters in the vicinity of transmission line towers in mountainous regions |